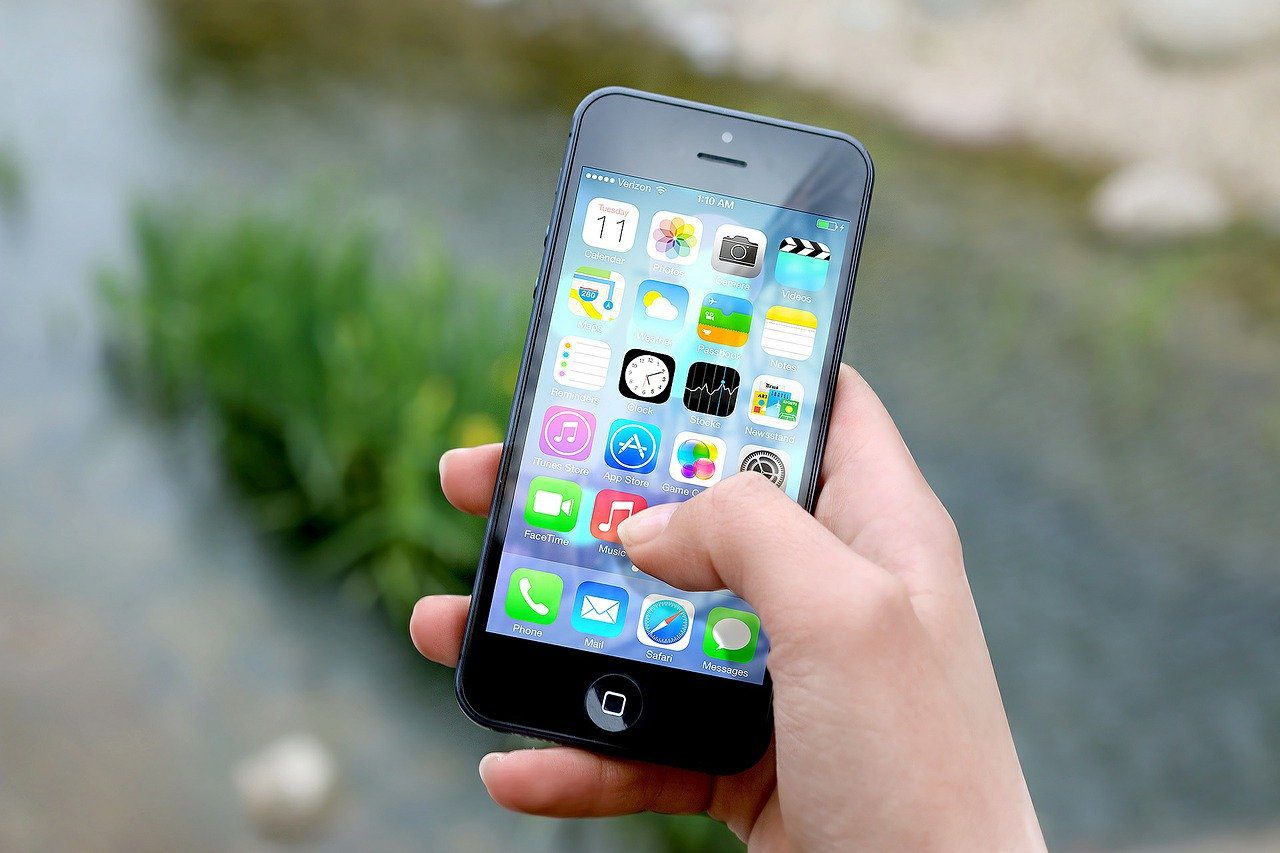
The latest monthly smartphone and mobile data from comScore show little change. Google’s Android continues to lead the US smartphone market, with 51 percent market share. Apple’s iOS is roughly 10 points behind. Microsoft’s smartphone market share is below three percent, and BlackBerry is at one percent.
What’s more interesting than the month-over-month figures is the longer-term trajectory of these operating systems. Below is a chart I put together showing those changes, with comScore data.
Changes in Mobile Operating System Share over Time

Data: comScore (2010–2015)
The above represents six years of comScore November smartphone data starting in 2010. That year, BlackBerry was the dominant operating system, with a 33.5-percent share, and Apple was second, with 26 percent. Google followed, with 25 percent, and Microsoft had nine percent.
It seems quite unlikely that Microsoft will recover market share, absent some radical change in its OS; Windows 10 doesn’t appear to have helped Windows Phones gain traction. BlackBerry is effectively dead as a consumer smartphone OS.
The only question, and the only drama in these numbers, comes from the question of whether Apple can capture market share from Google going forward. The two companies have been about 10 points apart for the past two years, with Samsung the dominant Android OEM.
Top 10 Mobile Apps (2013 – 2015)

Data: comScore
The table above reflects three years of November comScore data regarding the top apps by reach (installs). Noteworthy in the lists above are the following:
- The movement of Pandora from position 2 to position 8 (though the company says engagement with the app is greater than Facebook’s).
- The rise of YouTube from position 5 to position 2, which probably corresponds to the rise of larger-format smartphones and the effort Google has put into the YouTube app.
- Facebook has held its number one position over three years, and Messenger has risen from position 5 to position 3.
Source – MarketingLand.com


